| EXCEL VBA PRIMER | CCE 170 Brigham Young University Norm Jones |
| INTRO - | [Table of Contents] |
| EXCEL - | [Formulas] [VLOOKUP] [Validation] [Names] [Operators] [IF Function] [Goal Seek] [Charts] [Annotation] [Array Formulas] |
| VBA - | [VB Editor] [Macros] [Controls] [Ranges] [MsgBox] [Variables] [Objects] [If Then] [Debug] [Loops] [Arrays] [Strings] [User Forms] [Functions] [Excel Funs] [Subs] [Events] [Standards] |
| ADVANCED - | [Graphics] [E-mail] [Files] [Apps] [Google Sheets] |
A common task faced by programmers is how to display custom graphics using source code. It is often useful to display an object that is properly dimensioned in terms of the input parameters supplied on the user. For example, one could display the geometry of a cantilever beam or a column based on the user input. At the other end of the spectrum, it is possible to write sophisticated computer programs with 3D graphics and animation.
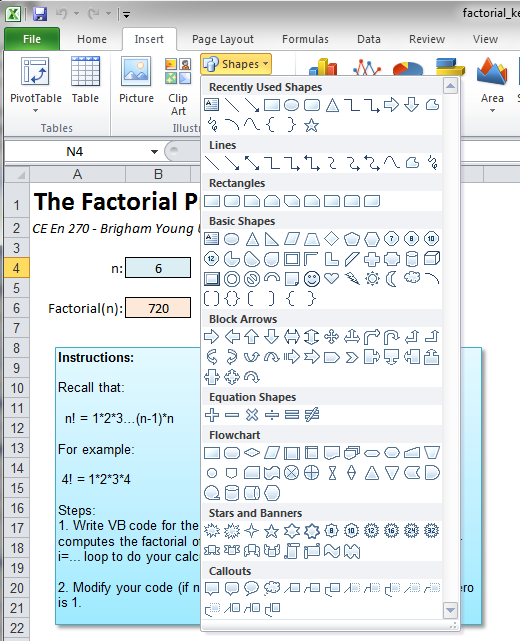
Standard VB (applied to a VB form) has a simple, yet powerful set of graphics options. You create a Picture object and then use a series of commands to draw lines and simple shapes in the Picture object. However, none of these tools can used for VBA in Excel. With Excel, an entirely different approach must be used. This approach involves a special type of object called a "Shape". Shapes can be created manually by the user of the spreadsheet using the standard MS Office drawing tools:
Any of the graphical objects in this menu (lines, connectors, basic shapes, etc.) are classified as shapes. Once created, they can be manipulated via VB code. Since the basic shapes include lines, rectangles, circles, and polygons, you can create just about any custom drawing that you can think of.
When dealing with shapes in VB code, we use the Shape object. All of the objects in the drawing layer of a worksheet, including AutoShapes, freeforms, OLE objects, or pictures, are Shape type objects.
To declare a variable as a Shape object, do the following:
Dim sh As Shape
The Creating Shapes section below discusses how to create Shape objects.
All of the Shape type objects associated with a specific sheet are organized into a set of objects called the Shapes collection. The Shapes collection is a special type of object that has it's own unique set of properties and methods. For example, you can traverse through all of the Shape objects in the Shapes collection using the following code.
'Check to see if there is already a polygon named "mypolygon"
'If so, we will delete it.
Dim sh As Shape
For Each sh In Shapes
    If sh.Name = "mypolygon" Then
        sh.Delete
    End If
Next sh
When you create a new Shape object, it is added to the Shapes collection.
The simplest way to create new shapes is to use one of the "Addxxx" methods associated with the Shapes collection. These methods include the AddLine, AddPolyline, and AddShape methods. Each of these methods creates a new shape object that is added to the Shapes collection.
The AddLine method creates a simple line defined by xy coordinates of the beginning and end of the line. The syntax for the method is:
expression.AddLine(BeginX, Beginy, EndX, EndY)
where expression is a Shapes type object. For example, the following code:
Shapes.AddLine 10, 10, 250, 250
creates a line that starts at the coordinates (10, 10) and ends at (250, 250) and adds it to the Shapes collection for the active worksheet. If you want to be more explicit about which sheet the shape is assigned to, you can use the following code:
Worksheets(1).Shapes.AddLine 10, 10, 250, 250
or
Worksheets("Sheet1").Shapes.AddLine 10, 10, 250, 250
The AddPolyline method creates a sequence of line segments defined by a list of coordinates. If the first coordinate is repeated at the end of the list, the method creates a closed polygon. The syntax for the method is:
expression.AddPolyline(SafeArrayOfPoints)
where expression is a Shapes type object and SafeArrayOfPoints is a 2D array of Singles representing the coordinates of the polygon. For example, the following code creates a polygon representing a triangle (from the VBA Excel Help File):
Dim triArray(1 To 4, 1 To 2) As Single
triArray(1, 1) = 25    'x coordinate of vertex 1
triArray(1, 2) = 100   'y coordinate of vertex 1
triArray(2, 1) = 100
triArray(2, 2) = 150
triArray(3, 1) = 150
triArray(3, 2) = 50
triArray(4, 1) = 25    ' Last point has same coordinates as first
triArray(4, 2) = 100
Shapes.AddPolyline triArray
Once again, the object is added to the Shapes collection for the current sheet.
The AddShape method can be used to create a new Shape object that is an AutoShape. The syntax for the method is:
expression.AddShape(Type, Left, Top, Width, Height)
where expression is a Shapes collection, Type is the type of AutoShape, and Left, Top, Width, and Height are singles defining the location and size of the object. For example, the following code creates a rectangle:
Shapes.AddShape msoShapeRectangle, 25, 50, 150, 200
The msoShapeRectangle is a VB constant defining the AutoShape type. The following are all legal AutoShape constants:
| msoShape16pointStar msoShape24pointStar msoShape32pointStar msoShape4pointStar msoShape5pointStar msoShape8pointStar msoShapeActionButtonBackorPrevious msoShapeActionButtonBeginning msoShapeActionButtonCustom msoShapeActionButtonDocument msoShapeActionButtonEnd msoShapeActionButtonForwardorNext msoShapeActionButtonHelp msoShapeActionButtonHome msoShapeActionButtonInformation msoShapeActionButtonMovie msoShapeActionButtonReturn msoShapeActionButtonSound msoShapeArc msoShapeBalloon msoShapeBentArrow msoShapeBentUpArrow msoShapeBevel msoShapeBlockArc msoShapeCan msoShapeChevron msoShapeCircularArrow msoShapeCloudCallout msoShapeCross msoShapeCube msoShapeCurvedDownArrow msoShapeCurvedDownRibbon msoShapeCurvedLeftArrow msoShapeCurvedRightArrow msoShapeCurvedUpArrow msoShapeCurvedUpRibbon msoShapeDiamond msoShapeDonut msoShapeDoubleBrace msoShapeDoubleBracket msoShapeDoubleWave msoShapeDownArrow msoShapeDownArrowCallout msoShapeDownRibbon msoShapeExplosion1 msoShapeExplosion2 |
msoShapeFlowchartAlternateProcess msoShapeFlowchartCard msoShapeFlowchartCollate msoShapeFlowchartConnector msoShapeFlowchartData msoShapeFlowchartDecision msoShapeFlowchartDelay msoShapeFlowchartDirectAccessStorage msoShapeFlowchartDisplay msoShapeFlowchartDocument msoShapeFlowchartExtract msoShapeFlowchartInternalStorage msoShapeFlowchartMagneticDisk msoShapeFlowchartManualInput msoShapeFlowchartManualOperation msoShapeFlowchartMerge msoShapeFlowchartMultidocument msoShapeFlowchartOffpageConnector msoShapeFlowchartOr msoShapeFlowchartPredefinedProcess msoShapeFlowchartPreparation msoShapeFlowchartProcess msoShapeFlowchartPunchedTape msoShapeFlowchartSequentialAccessStorage msoShapeFlowchartSort msoShapeFlowchartStoredData msoShapeFlowchartSummingJunction msoShapeFlowchartTerminator msoShapeFoldedCorner msoShapeHeart msoShapeHexagon msoShapeHorizontalScroll msoShapeIsoscelesTriangle msoShapeLeftArrow msoShapeLeftArrowCallout msoShapeLeftBrace msoShapeLeftBracket msoShapeLeftRightArrow msoShapeLeftRightArrowCallout msoShapeLeftRightUpArrow msoShapeLeftUpArrow msoShapeLightningBolt msoShapeLineCallout1 msoShapeLineCallout1AccentBar msoShapeLineCallout1BorderandAccentBar msoShapeLineCallout1NoBorder |
msoShapeLineCallout2 |
Once a shape is created, the properties of the shape can be modified using VB code. For example, the following code creates a polygon and then sets some of the properties of the polygon such as the color and the fill style:
Dim sh As Shape

Set sh = Shapes.AddPolyline(triArray)

With sh
    .Name = "mypolygon"
    .Fill.ForeColor.RGB = vbBlue
    .Fill.Solid
End With
Note that we must use the Set command to assign the sh variable to the value returned by the AddPolyline method. This style must be used for all assignment statements involving objects. Another way to achieve the same thing would be as follows:
With Shapes.AddPolyline(triArray)
    .Name = "mypolygon"
    .Fill.ForeColor.RGB = vbBlue
    .Fill.Solid
End With
In other words, we can skip the sh variable and assign the properties at the same time that we create the Shape object.
Notice that the Addxxx methods can be called as either functions or sub procedures. When you call it as a function you should put the arguments in parentheses. When you call it as a sub, you should not use parentheses. For example, the following line calles the AddPolyline method as a sub procedure:
Shapes.AddPolyline triArray
While the following code calls the same method as a function:
Set sh = Shapes.AddPolyline(triArray)
In most cases involving custom graphics, you will have a plot that gets updated each time the user changes the input. Theoretically, when you redraw the plot, you could simply resize the existing shapes or you could create a new set of shapes. Unfortunately, it is difficult or impossible to resize some shapes. Therefore, each time you draw your plot, you will be creating a new set of shape objects. What happens to the old shapes when we create the new shapes? You certainly don't want to create the new shapes on top of the old shapes, or you will get a mess.
My solution to this problem is to give each of my shapes a unique name when I create it (see the sample code for the AddPolyline method above). Then, right before I draw my new shapes, I loop through all of the existing shapes and delete the current instances of my custom shapes. The following code searches through the Shapes collection and deletes two lines and a rectangle:
Private Sub Remove_MyShapes()
'Check to see if we have already created our shapes
'If so, we will delete them.
Dim sh As Shape
For Each sh In Shapes
    If sh.Name = "myrect" Or sh.Name = "line1" Or sh.Name = "line2" Then
        sh.Delete
    End If
Next sh
End Sub
When you use this approach, you have to be sure you name your shapes consistently.
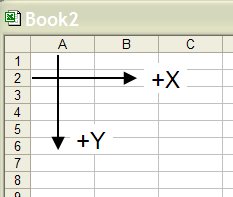
Perhaps the most important (and potentially the most difficult) part of creating shape objects in VB code is to make sure that the objects are created at the proper location and at the proper size on the spreadsheet. Note that all of the methods described above for creating shapes are defined in terms of some coordinate system. The default coordinate system for Excel is defined as follows:
In other words, the upper left corner of the spreadsheet is the origin (0,0) with x increasing to the right and y increasing to the bottom. The coordinates are based on pixels.
The default coordinate system is not always very helpful. Typically, we want to define the coordinates of the Shapes using our own custom coordinate system using a tradition orientation (y is positive in the up direction). In order to do this, we must set up a coordinate transformation between our custom coordinate system which we call the world coordinate system and the screen coordinate system. The math that is used to perform this coordinate transformation is fairly simple, but I won't describe it in detail here. You can consult any book on basic computer graphics for a full explanation. Rather, I will focus on how to set up and use the transformation.
The first step in setting up the transformation is to define a set of four transformation variables as follows:
'Coefficients for coordinate transformation
Dim a As Double
Dim b As Double
Dim c As Double
Dim d As Double
These variables can be local or global. The following source code examples all assume that they have been defined as global variables at the top of your source code.
Once these variables are set up properly (which will be discussed below), we can transform world coordinates to screen coordinates using the following code:
Private Sub transform_coords(ByRef x As Double, ByRef y As Double)

    x = x * a + b
    y = y * c + d

End Sub
For example, the following code creates a Line shape with the world coordinates startxy = (20,20) and endxy = (100,120):
Dim x1 As Double
Dim y1 As Double
Dim x2 As Double
Dim y2 As Double

x1 = 20
y1 = 20
x2 = 100
y2 = 120

transform_coords x1, y1
transform_coords x2, y2

Shapes.AddLine x1, y1, x2, y2
Before calling the transform_coords sub, we must first initialize the values of the transformation variables. When we do this, we went to set up the transformation so that any world coordinates are transformed into a specific place on our spreadsheet. It is pretty easy to decide on a range in our spreadsheet where we want something to be drawn, but how do we determine the screen coordinates for that range? I have found that the best way to do this is to identify the range as a Range object in VB code and use the .Left, .Right, .Width, and .Height properties of the range.
The following VB sub takes the dimensions of world coordinate range to be used for the graphics and a Range object defining the screen location of the graphics and it initializes the value of the transformation coordinates such that the objects defined in the specified world coordinate range will be centered in the screen range with at least a 10% cushion on the sides (left, right, top, bottom). The aspect ratio is always preserved. This means that the cushion in the vertical direction (or the horizontal direction) may end up being larger than 10%.
Private Sub set_up_transformation(xmin As Double, _
                                  xmax As Double, _
                                  ymin As Double, _
                                  ymax As Double, _
                                  drawrange As Range)
'Sets up the global transformation matrix so that any coordinates within the given
'world coordinate bounds will be drawn inside of the specified range with a 20%
'cushion.

Dim xdomain As Double
Dim ydomain As Double
Dim plotratio As Double
Dim polyratio As Double
Dim plotwidth As Double
Dim plotheight As Double
Dim plotleft As Double
Dim plotbot As Double
Dim Sx As Double
Dim Sy As Double

xdomain = xmax - xmin
ydomain = ymax - ymin

polyratio = ydomain / xdomain
plotratio = drawrange.Height / drawrange.Width

If polyratio > plotratio Then
    'y range is the dominant range
    plotwidth = ydomain / plotratio * 1.2
    plotheight = ydomain * 1.2
Else
    'y range is the dominant range
    plotwidth = xdomain * 1.2
    plotheight = xdomain * plotratio * 1.2
End If

plotleft = (xmax + xmin) / 2 - plotwidth / 2
plotbot = (ymin + ymax) / 2 - plotheight / 2

Sx = drawrange.Width / plotwidth
Sy = -drawrange.Height / plotheight

a = Sx
b = drawrange.Left - Sx * plotleft
c = Sy
d = (drawrange.Top + drawrange.Height) - Sy * (plotbot)

End Sub
Here is a sample call to this sub that sets up the mapping over a world coordinate x range of 10 to 100 and a y range of -20 to 120:
set_up_transformation 10, 100, -20, 120, Range("F12:L20")
In summary, the following code initializes the transformation variables, maps the coordinates, and draws a line:
Dim x1 As Double
Dim y1 As Double
Dim x2 As Double
Dim y2 As Double

set_up_transformation 20, 100, 20, 120, Range("F12:L20")

x1 = 20
y1 = 20
x2 = 100
y2 = 120

transform_coords x1, y1
transform_coords x2, y2

Shapes.AddLine x1, y1, x2, y2
Note that this code only draws one line. If you want to draw
multiple objects in the same window using the same coordinate mapping, you need
to be sure to call the set_up_transformation sub once before you
transform any coordinates and make sure that xmin, xmax, ymin, & ymax are set up
according to the limits of all of the objects combined.