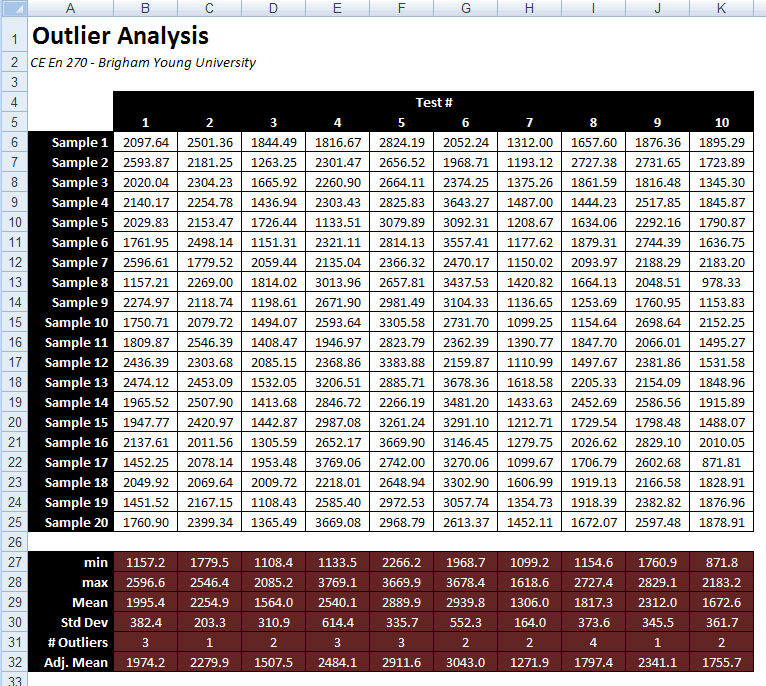
The following spreadsheet analyzes the results from a laboratory test. The measured strengths of a series of specimens from ten tests are listed in the columns of the table.

Click here to download a copy of this spreadsheet minus the formulas in the bottom section. To complete this assignment, do the following:
1. Enter the Excel formulas at the bottom of each column to compute the minimum, maximum, mean (average), and standard deviation for the samples in the test.
2. Create a custom VB function called num_outliers to compute the number of outliers in each column. In this case, an outlier is defined as a value that differs from the mean (higher or lower) by more than 1.5 times the standard deviation. Enter a formula in the "# Outliers" row that uses this custom function to display the number of outliers. This function should take three arguments as input and return an integer. The first argument is the range of cells to analyze (the column of test values above the cell), the second argument is the mean, and the third is the standard deviation. You can get the mean and the standard deviation from the values you have already computed in rows 28 and 29.
3. Create a custom VB function called adj_mean that computes an adjusted average for each column of data values. The adjusted mean should omit all outliers. In other words, you will compute the sum of the non-outlier values and divide by the number of non-outliers. Enter a formula in the "Adj. Mean" row that uses this custom function to display the adjusted mean. This function will have the same three arguments as the num_outliers function.
Put your custom functions in the module named Outlier_Functions.
Hint: You will need to use the "For Each ... Next" construct to loop through the cells in the input range in both of your custom functions.
1. Be sure to save the changes to your spreadsheet.
2. Upload your spreadsheet via Learning Suite.